Lately I’ve seen quite a bit of discussion about using exercise to counteract loss of muscle mass in persons taking GLP-1 agonists, so today I’ll review the effects of diet and physical activity on body composition.
In 1994, I came across a commentary by the noted body composition researcher Gilbert B. Forbes, M.D.. I lost the citation, but saved the figure below (slightly modified with the addition of data points after he published it). This is the most brilliant illustration I’ve seen in all of exercise science. It is old-school insightfulness that scientists used to practice on chalkboards and the back of envelopes, involving a level of logic and deduction not seen today. In my experience, body composition research is all consistent with Forbes’s simple figure, below:
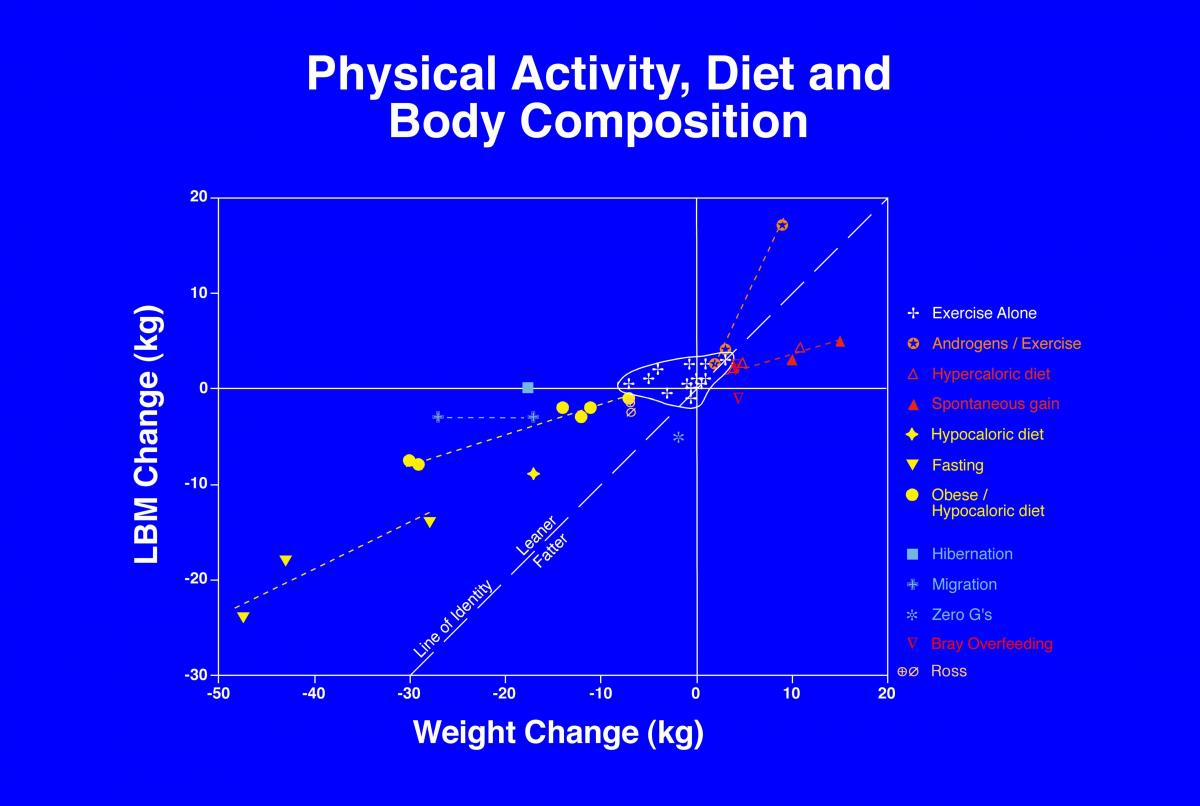
The figure plots change in total body mass vs change in lean body mass, illustrating what happens to body composition during weight loss or weight gain. Each point represents the group mean of an entire study - a “graphical meta-analysis”, if you will.
Note the dashed line at a 45º angle through the origin. This is the line-of-identity where the change in total weight equals the change in lean body mass (i.e., no change in fat mass). Points lying above the line-of-identity indicate that percent body fat decreased, points lying below the line-of-identity means that percent body fat increased.
The most striking aspect of this figure is that, other than a cloud of studies around the origin, all of the data points are in quadrants I (weight and lean mass both increasing) and III (weight and lean mass both decreasing). There are no data points out in the outer reaches of quadrants II (weight decreasing with lean mass increasing) and IV (weight increasing with lean mass decreasing). Thus, human (and likely mammalian) metabolism is anabolic or catabolic, either stepping on the gas or on the brake, there is no mixing by tissue type.
The cloud of white data points around the origin show studies of exercise alone. Exercise in the absence of dietary change causes ~2 kg of weight loss, with a similar amount of gain in lean mass. Good enough for trimming, but meaningful weight change requires dietary intervention.
The points plotted in yellow show the effects of weight loss. These points hug the X axis near the origin but with more substantial weight loss they dive down to be more parallel to the line-of-identity. Lean mass is spared during initial weight loss, but the sparing effect diminishes as weight loss becomes larger.
The points plotted in red show the effects of weight gain. The slope of the regression line of these studies suggests that gaining weight involves a mix of gaining more fat mass than lean mass.
The points plotted in orange show the effect of exercise while taking testosterone. Unfortunately, that regression line is heavily driven by a single study far from the origin with other studies were sufficiently close to the origin as to be in the “cloud” of data points on exercise alone. More recent studies looking at special populations suggest it may be possible to gain lean mass while losing fat mass (quadrant II), but even those studies are within the “cloud” of data points near the origin.
It is hard to do androgen research that mimics doping in athletes, because athletes often take them in great excess of the maximum recommended dose, and often taking multiple androgens in combinations that are not pharmacologically recommended. This is too risky to get approved for experimentation in human subjects, so as a result there is little conclusive evidence on exercise, diet and body composition in athletes taking androgens. Nonetheless, it is noteworthy that data from androgen studies lies on the leaner side of the line-of-identity.
The points in blue show three other kinds of studies that are most intriguing. One shows the effects of exposure to microgravity, which suggests that astronauts preferentially lose muscle mass during space flight. Muscular exertion is greatly reduced in microgravity, resulting in deconditioning.
The other two in blue are animal studies - one migration and the other hibernation. Both show preservation of lean mass despite significant weight loss. In migration and hibernation, fat is the only fuel. Gosh, imagine if all you had to do to lose your excess fat was sleep!!!
What are the take-home points?
- Mammals seem to live in a narrow band of being either anabolic or catabolic.
- Exercise without calorie intervention yields clinically insignificant amounts of gain or loss, but generally has a trimming effect.
- Whether gaining or losing weight, the natural pattern is a mix of both lean mass and fat mass, with changes in fat mass seeming to be greater than lean mass.
- Some animal species that migrate or hibernate can lose weight entirely through fat mass.
- Outside of taking supplemental androgens (which remain inconclusive), there does not appear to be a simple way of preferentially gaining muscle mass.
- There is no convincing evidence for the concept of losing weight and gaining muscle. Whether or not it is possible to go through cycles of weight gain and loss and thereby move up and left is unknown. Perhaps some combination of sequential losses and gains can do this over time, but simple weight change studies suggest this is a myth.
- GEMoore
- GE Moore MD's blog
- Log in to post comments
- Follow our Blog